Why “understand behavior” means different things
You’ve probably said you want to “understand behavior” when what you really mean is “tell me what to fix.” The problem is that behavior can mean at least three different things: what people did (clicked, scrolled, purchased), how many did it (conversion rate, drop-off), and why they seemed stuck (rage clicks, back-and-forth navigation, form errors). Traditional dashboards often over-serve the second and under-serve the third, which is why they feel both detailed and unhelpful.
A marketing lead might need a clean story from landing page to lead form, while a product lead needs to see where onboarding breaks for new users. Those are both “behavior,” but they demand different evidence. If you don’t pick the meaning first, you’ll end up paying for a tool that produces numbers you can’t act on, or videos you can’t quantify.
There’s also a practical constraint: clarity costs something. Event tracking takes setup and discipline, and session tools create noise you must triage. The best choice is the one that turns your most common questions into decisions within a day, not a week.
Start with your site: content, ecommerce, or product
Picture the question you ask most often on Monday morning. If your site is mostly content, your “behavior” problem is usually attention and navigation: which articles pull people deeper, where they stop scrolling, and what internal links actually get used. You can get far with lightweight page and scroll signals, because the goal is often “more of the right reading,” not a precise transaction.
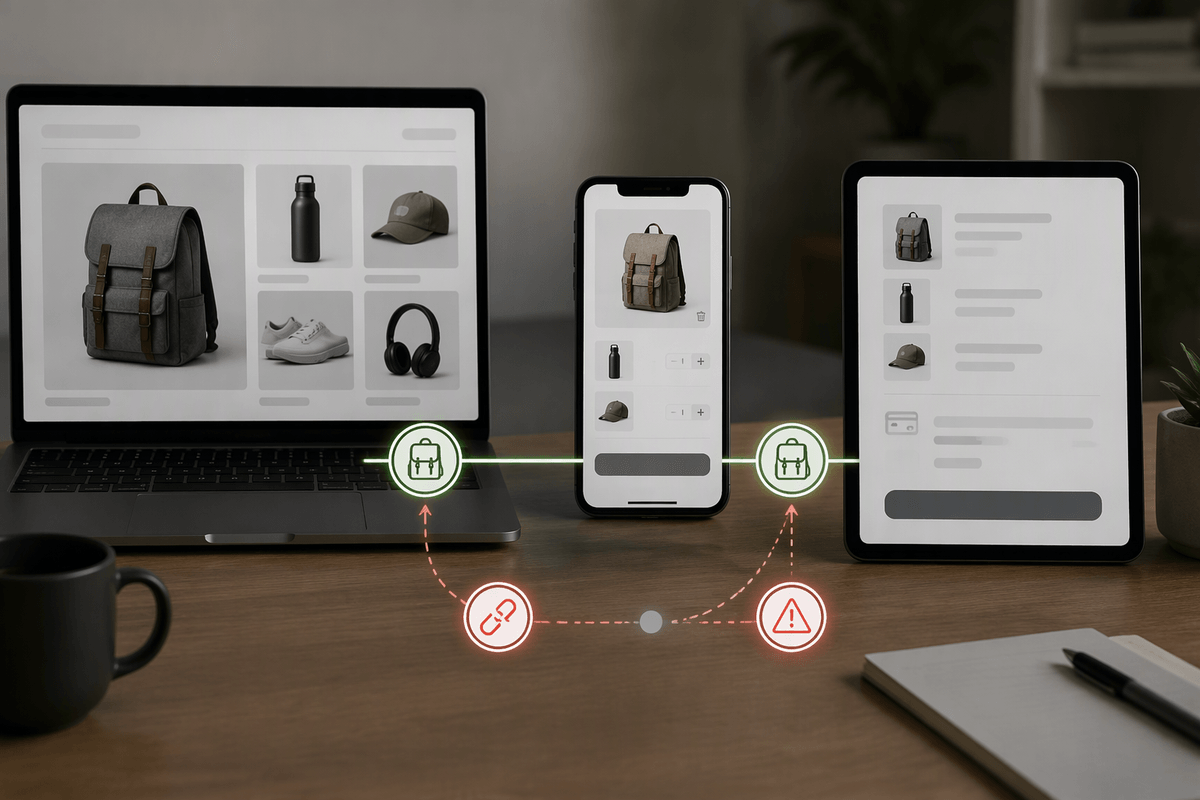
If you run ecommerce, your site already has a built-in funnel: view item, add to cart, start checkout, purchase. The hard part is separating “not interested” from “couldn’t complete,” which means you need clean event definitions and consistent product/checkout tracking across devices and browsers. That takes real implementation time, and small tracking mistakes can make entire reports misleading.
If you’re a product or SaaS team, the website is only the front door. The questions shift to activation and retention inside the app, where one missing event or one renamed button can break the story you’re trying to tell.
Two lenses: numbers-first versus session-first tools
You’ll usually end up looking through one of two lenses. Numbers-first tools treat behavior as a dataset: events, properties, segments, and funnels that can answer “how many” and “which step” with confidence. When they’re set up well, you can compare cohorts, spot a single leaky step, and measure whether a fix worked. The trade-off is that you have to decide what to track before you need it, and that planning takes time across marketing, product, and engineering.
Session-first tools treat behavior as evidence: replays, heatmaps, and on-page frustration signals that answer “what did they try to do?” They’re especially useful when you suspect confusion (a form, pricing page, or checkout) and need to see it, not infer it. The trade-off is volume and ambiguity. Watching sessions doesn’t scale, sampling can miss edge cases, and privacy settings can reduce the detail that makes the replay valuable.
If you want clear funnels, events matter most
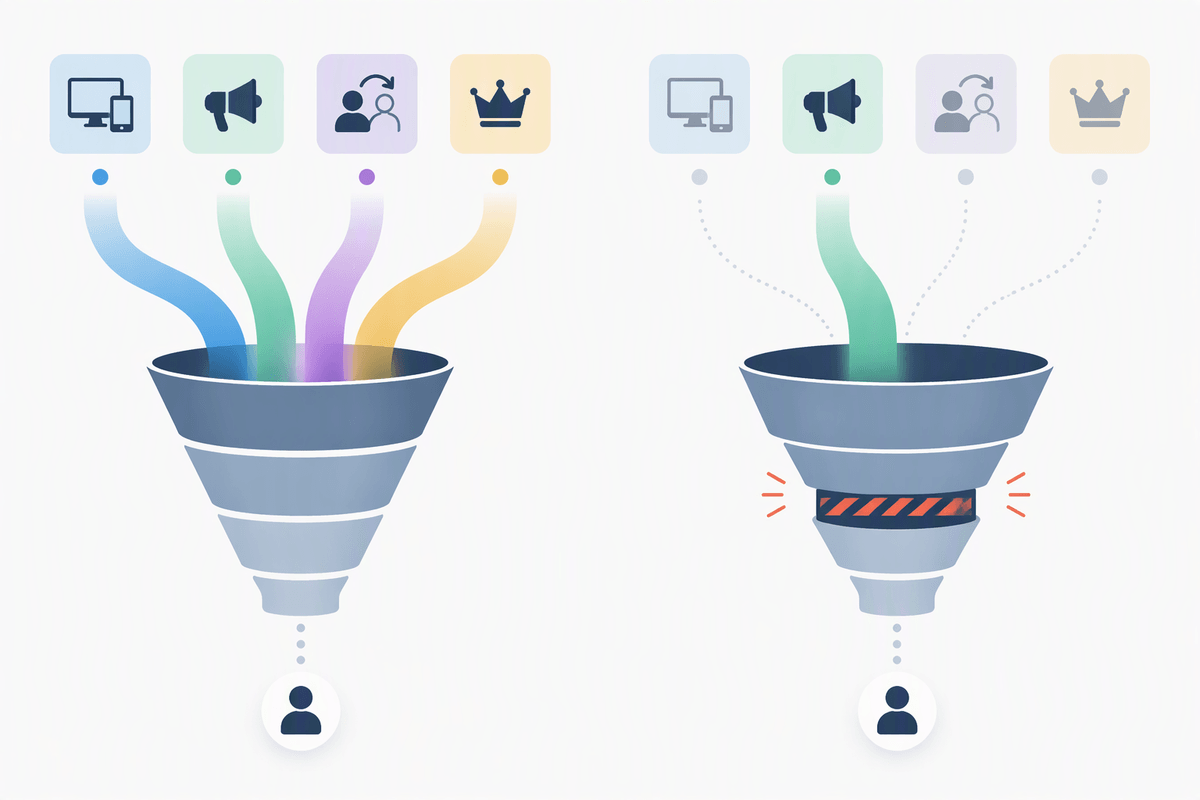
You recognize the moment you need events: someone asks, “Where are we losing people?” and you can’t answer without guessing. A clear funnel is not a chart style. It’s a set of deliberate steps (view pricing, start trial, hit onboarding step 1, invite teammate, finish setup) with rules about what counts, in what order, and within what time window. When those steps are tracked as events, you can point to a specific drop-off and say, “This step is the problem,” instead of debating opinions in a meeting.
Events also let you separate “traffic changed” from “behavior changed.” You can segment by channel, device, new versus returning, or plan type and see whether the leak is broad or isolated. That matters because the fix is different: a paid campaign mismatch is not the same as a broken form field.
The limitation is real: good funnels require instrumentation work, naming discipline, and ongoing maintenance. A single missing event after a redesign can make a funnel look healthier or worse than it is, and small teams feel that cost quickly.
If you want “why,” replays and heatmaps win
You know the “why” problem when a metric is clearly bad, but you can’t tell what’s actually happening on the page. The landing page has traffic, the checkout funnel drops, or the signup form abandonment spikes, yet your dashboard can only say “they left.” Replays and heatmaps are built for that gap. They show patterns you can’t reasonably infer from events alone: people hovering over non-clickable elements, scrolling past the call to action, missing an error message, or repeatedly clicking a disabled button.
Heatmaps give you fast directional evidence (“nobody reaches the comparison table”), while replays give you the story behind it (“the cookie banner covers the pricing toggle on mobile”). The trade-off is operational: you need sampling rules, filtering, and a review habit, or you’ll drown in sessions. You also have to accept redaction and masking for privacy, which can hide the exact field or text that caused the confusion.
Privacy, cost, and ownership change the best pick
You’ll feel the tool choice change the moment you ask, “Are we allowed to collect this?” Session recording is the first place privacy bites, because “seeing what happened” can accidentally capture personal data. Most tools offer masking and redaction, but that reduces usefulness and still requires careful configuration, reviews, and internal access controls. If you operate under stricter rules (health, finance, kids, or certain EU traffic), you may prefer event-only tracking, shorter retention, or a self-hosted option, even if it’s less visually satisfying.
Cost is rarely just the subscription. Events-first tools often cost engineering time up front and maintenance after every redesign. Session tools can look cheap until you hit higher traffic tiers, need longer retention, or want more seats so product, design, and support can actually use it. Ownership matters too: if you can’t export raw data, control retention, or keep historical definitions stable, you risk “insight debt” where last quarter’s decisions can’t be audited or compared.
Practical recommendations: simplest stack for your goal
If you mainly need a weekly scoreboard and reliable drop-off points, start with one events-first product analytics tool and a short list of “must-not-break” funnels (signup, checkout, lead form). Keep the event plan small, review it monthly, and treat renames like code changes. Add a lightweight dashboard only if stakeholders need it.
If your real pain is “people complain, but we can’t reproduce it,” start with a session replay + heatmap tool focused on your highest-value pages. Use sampling, tag a small set of key pages, and set a review routine (for example, 30 minutes twice a week) so it doesn’t become noise.
If you can afford two tools, pair events for measurement with replays for diagnosis, but limit overlap: events define success; replays explain surprises.