Dashboards fail when everything looks important
You’ve seen the dashboard where every tile is the same size, every number is bold, and every chart uses the loudest color. It feels “complete,” but it’s hard to answer the one thing the stakeholder actually came for: what’s going on, and what should we do? When everything is emphasized, nothing is. Readers scan, bounce between panels, and leave with a vague sense that something might be wrong.
This usually happens when teams keep adding “one more metric” to satisfy different opinions, without deciding what matters most for the decision at hand. The cost is real: slower meetings, more follow-up questions, and decisions made from whichever number someone noticed first.
Rule 1: Start with the key question, not charts
Most dashboard rebuilds start with a chart type: a trend line for traffic, a funnel for conversion, a map for regions. That’s backwards. Before you place anything on a canvas, write the key question the dashboard must answer in plain language, the way a stakeholder would say it in a meeting: “Are we growing in the right way?” “Did the release hurt retention?” “Where are we losing revenue?” If you can’t fit the question in one sentence, you’re probably mixing multiple decisions.
Once the question is explicit, choosing metrics becomes a filtering exercise instead of a negotiation. Anything that doesn’t help answer that question is either secondary detail or a different dashboard. This is the hard part politically: you will disappoint someone whose favorite metric gets demoted. The practical cost is that it takes a few real conversations to pin down the decision owner, the time horizon (this week vs. this quarter), and what action the team would take if the answer is “good” or “bad.”
Rule 2: Put the most important KPI first
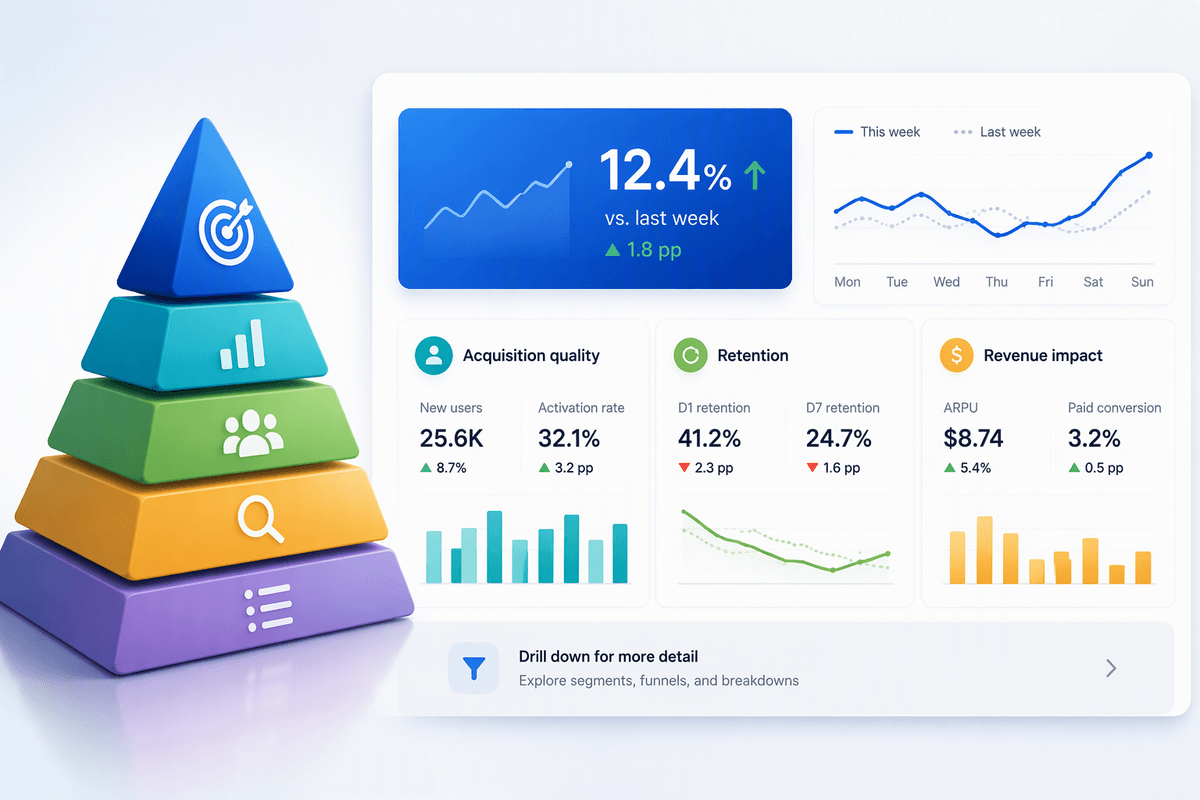
Picture a stakeholder opening your dashboard in a meeting: they won’t read it like a report. They’ll glance at the top-left, then the biggest element, then whatever looks most “official.” If your primary KPI isn’t sitting there, you’ve already lost control of the narrative. Put the single KPI that best answers the key question first, and make it unmistakably the anchor—one number, clearly labeled, with a small indicator of direction versus the right comparison (last week, last release, target).
This doesn’t mean “pick the metric you like.” It means picking the metric the decision owner will act on. If the question is “Did the release hurt retention?” then lead with retained users or retention rate, not signups. If the question is “Are we growing profitably?” lead with contribution margin or net revenue, not sessions. The trade-off is political and practical: you’ll need alignment on definitions, and you may have to delay the layout until tracking and targets are trustworthy.
Rule 3: Group related metrics into clear sections
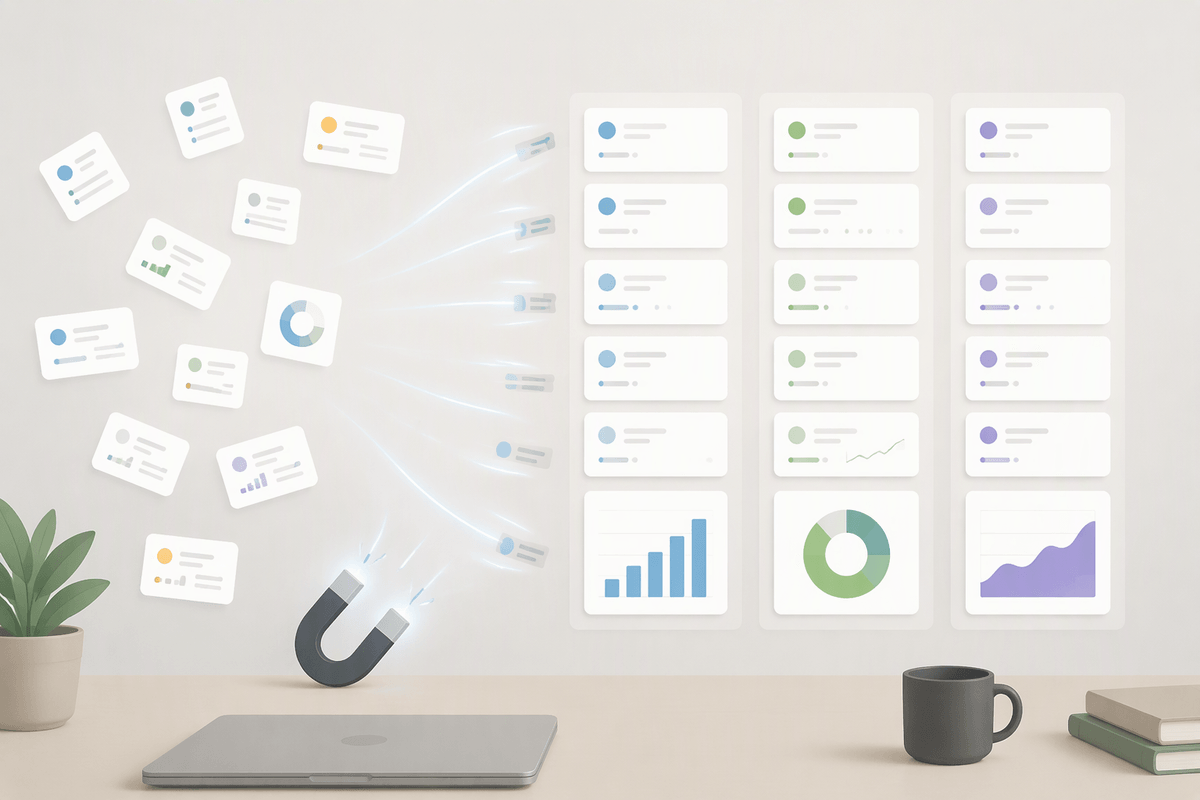
Even with a clear primary KPI, dashboards get noisy when related metrics are scattered. Readers spend their attention doing layout work: “Is this chart explaining that number, or something else?” Grouping solves that. Put metrics that answer the same sub-question together, and make each group feel like a unit: a short header, 2–4 supporting metrics, and one visual that explains the movement. For a retention dashboard, that might be one section for “Acquisition quality” (new users, activation rate), one for “Retention” (D1/D7 retention, churn), and one for “Revenue impact” (ARPU, paid conversion).
Keep sections separated by whitespace and consistent alignment, not heavy boxes. Boxes tend to make everything feel equally “final,” and they add visual weight fast. The constraint is real: sectioning forces you to choose where a metric belongs. When a metric could fit in two places, that’s a signal it’s either a bridge metric (worth calling out once) or a distraction that should move to a drill-down view.
Rule 4: Use consistent visual emphasis and patterns
You’ve probably watched someone misread a dashboard because your visuals taught them the wrong “rules.” A red number in one place means “bad,” but elsewhere red is just the brand palette. One chart uses a thick line for this week, another uses it for last week. That inconsistency forces readers to decode the UI before they can interpret the data, and they’ll often default to whatever looks loudest.
Set a small, repeatable visual language and stick to it: one accent color reserved for the primary KPI and the one series you want compared against it; muted colors for supporting context; the same time comparison shown the same way every time (for example, solid line for current, dotted for previous). Use the same number format, the same axis treatment, and the same placement for change indicators across sections. The practical constraint is maintenance: every “special case” costs you later, because it breaks the pattern and makes the dashboard harder to extend without confusion.
Rule 5: Reveal detail progressively, not all at once
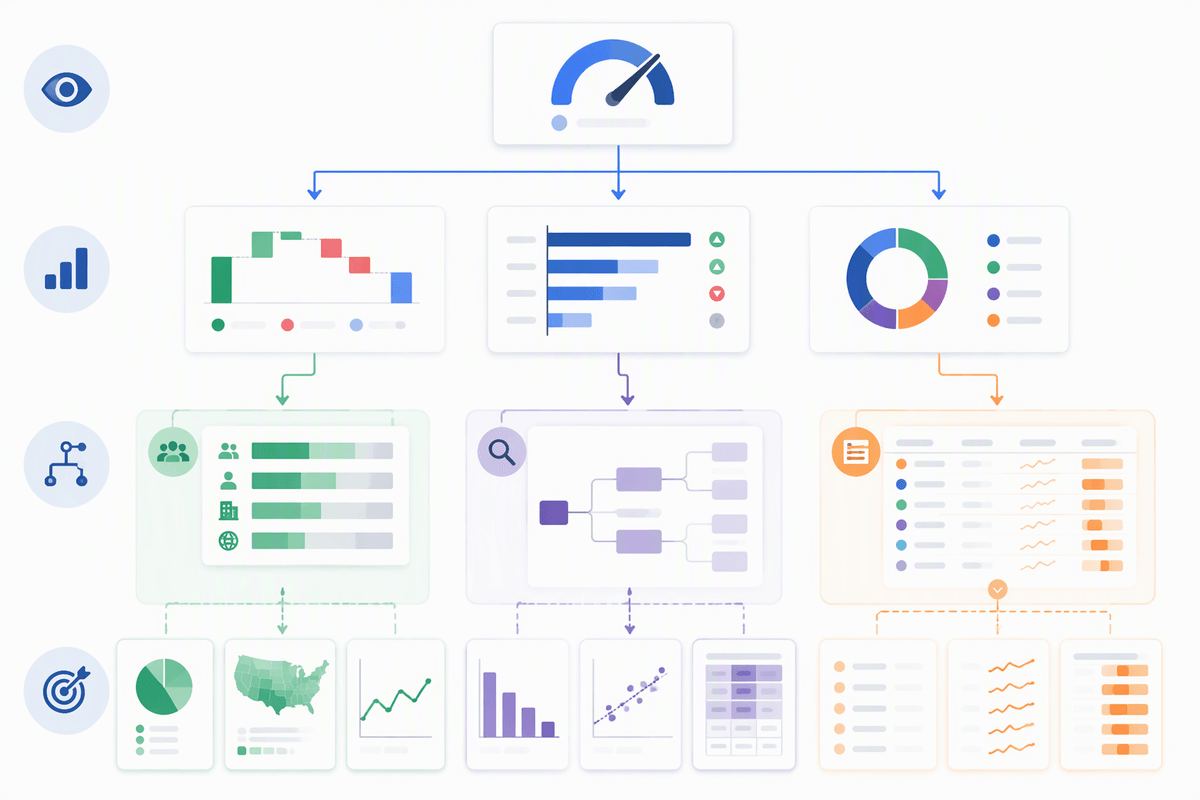
You know the moment: someone opens the dashboard and immediately asks for “just one more breakdown.” Not because the dashboard lacks data, but because it shows too much detail too early. When every segment, filter, and micro-metric is visible upfront, readers start exploring instead of orienting. They click before they understand what changed, and the meeting turns into a live investigation.
Design for a short path from overview to explanation. Start with the primary KPI, then the two or three drivers that typically explain it. Keep the first screen focused on “what happened” and “why,” and push everything else into progressive layers: a secondary tab for segmentation, a drill-down view for root cause, or an expandable table for long tails. If a stakeholder only has 30 seconds, they should still leave with the correct takeaway.
The constraint is real: progressive disclosure takes extra build time and careful governance. You’ll need to decide which breakdowns are standard, which are ad hoc, and who owns keeping drill-down definitions consistent as the business changes.
A quick hierarchy checklist for your next dashboard
Open your dashboard and do a fast pass: can you state the key question in one sentence, and does the first thing your eye hits answer it? Is there exactly one primary KPI that’s visually dominant, with the right comparison (vs. last period or target) and a plain label? Can you point to 2–4 sections where every supporting metric clearly explains the KPI, rather than competing with it?
Check for consistency: do colors, line styles, and change indicators mean the same thing everywhere? Finally, hide the temptation: if you removed every segment filter and detailed table from the first view, would the takeaway get clearer? If yes, push that detail into drill-downs and accept the extra build and upkeep cost.